It is common today to hear news about the impending turn in the credit cycle, worries about a recession and fears of a major credit market correction. Against this wall of worry, we’ve seen credit spreads and bond performance stay relatively resilient, with new tights and minor corrections in early 2018. This raises a few questions: Where does the credit market go from here? How much longer can this credit cycle last? And when did our current credit cycle actually begin?
We hear a lot about the length of this credit cycle. The seemingly continuous bull market since the great recession of 2008/2009 implies that this credit cycle has been about 10 years long. Looking at some market metrics, however, may indicate the credit market bull cycle ended a couple of years ago. The market then endured the correction and began its way into the early innings of our new and current credit cycle.
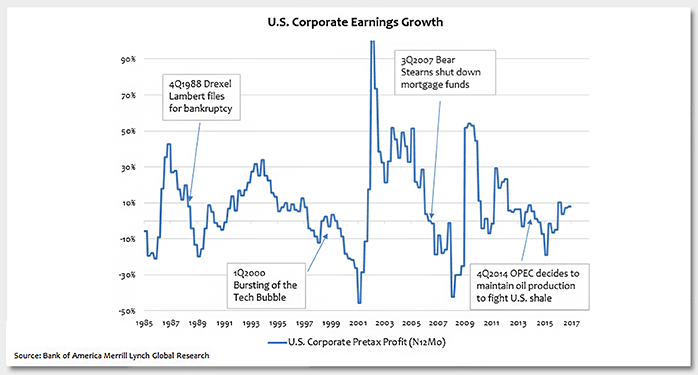
As seen in the chart of the week in 2014, corporate earnings over the next 12-month period actually went negative year-over-year. This came after OPEC’s decision in 4Q14 to fight U.S. shale producers by maintaining production, which led to the subsequent rout in energy prices. In turn, commodity companies in the oil and gas as well as metal and mining industries experienced major earnings deterioration, materially widening credit spreads and a spike in default rates. While the correction seemed to come and go relatively quickly, Bank of America High Yield strategists point out that if we compare it to prior credit cycle corrections, it has many of the same characteristics: an increase in leverage, negative corporate earnings, a decrease in the growth of capital spending and materially widened credit spreads for the heightened default risk. Perhaps this bull credit cycle actually ended in 4Q14/15, and the 2016 rebound year (with total returns approaching 19%) was actually the beginning of the new credit cycle.
Key Takeaway
Investors remember the tech bubble bursting in 2000 and the collapse of Bear Stearns’ mortgage funds in late 2007, however, fewer investors today can recall the collapse of Drexel Lambert in late 1988. Still, we can agree that these events seemed to mark the end of those bull credit cycles. It’s difficult to know when it’s the bottom of the market or when the credit cycle will turn again, but looking back at the OPEC production decision, it may have actually marked the end of the bull credit cycle (U.S. high yield spreads widened materially from the tights of 393 basis points [bps] in 2Q14 to 920 bps in 1Q16). Today, the high yield market sits at a spread of 398 bps, up from the tights of 368 bps, which is only a modest correction compared to the one we had a few years ago.[1] Therefore, it’s possible that we have longer to go in this nascent current credit cycle than most investors realize, and this bull market can continue to climb its wall of worry.
[1] Source: J.P. Morgan U.S. High Yield Index
The material provided here is for informational use only. The views expressed are those of the author, and do not necessarily reflect the views of Penn Mutual Asset Management.
This material is for informational use only. The views expressed are those of the author, and do not necessarily reflect the views of Penn Mutual Asset Management. This material is not intended to be relied upon as a forecast, research or investment advice, and it is not a recommendation, offer or solicitation to buy or sell any securities or to adopt any investment strategy.
Opinions and statements of financial market trends that are based on current market conditions constitute judgment of the author and are subject to change without notice. The information and opinions contained in this material are derived from sources deemed to be reliable but should not be assumed to be accurate or complete. Statements that reflect projections or expectations of future financial or economic performance of the markets may be considered forward-looking statements. Actual results may differ significantly. Any forecasts contained in this material are based on various estimates and assumptions, and there can be no assurance that such estimates or assumptions will prove accurate.
Investing involves risk, including possible loss of principal. Past performance is no guarantee of future results. All information referenced in preparation of this material has been obtained from sources believed to be reliable, but accuracy and completeness are not guaranteed. There is no representation or warranty as to the accuracy of the information and Penn Mutual Asset Management shall have no liability for decisions based upon such information.
High-Yield bonds are subject to greater fluctuations in value and risk of loss of income and principal. Investing in higher yielding, lower rated corporate bonds have a greater risk of price fluctuations and loss of principal and income than U.S. Treasury bonds and bills. Government securities offer a higher degree of safety and are guaranteed as to the timely payment of principal and interest if held to maturity.
All trademarks are the property of their respective owners. This material may not be reproduced in whole or in part in any form, or referred to in any other publication, without express written permission.


