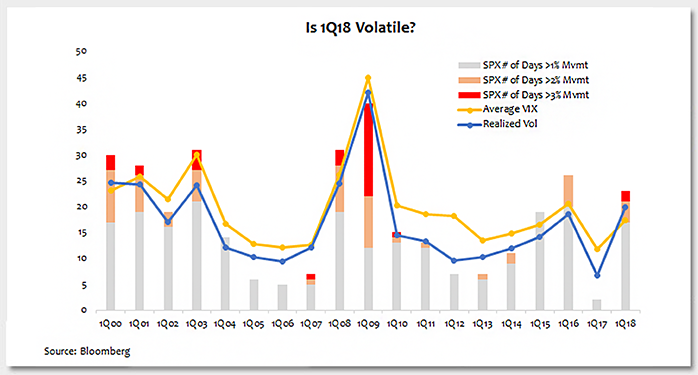
Is 1Q18 equity market volatile? It surely feels so. According to the chart, there were 23 days during 1Q18 in which the S&P 500 Index (SPX) moved more than 1% in either direction, compared to two days in 1Q17 and eight days in all of 2017. We have also experienced two days of more than 3% movement, which has not happened since 2010. On the morning of February 6, CBOE Volatility Index (VIX) touched 50. Several drivers contributed to the more volatile market:
- No more cheap money, due to rising interest rates and normalizing the Fed balance sheet. It was the February wage data that exacerbated these concerns and fused the equity selloff.
- Looming U.S.-China trade war tension.
- Sector correlations bounce back.
- Another $250B in assets flowed into passively managed strategies in 2017. I believe this not only increased the sector correlations, but also thinned market liquidity.
- Last but not least, the VelocityShares Daily Inverse XIV Short-Term exchange-traded note (XIV) was liquidated. It had over $2B in volatility selling.
Does 1Q18 still feel volatile if 2017 had not happened? 1Q16 had more 1% movement days than 1Q18. From 2000 to 2017, there were six years during which 1Q had more 1% movement days than 1Q18. On average, first quarters since 2000 have had 18 1% movement days. All these make me think that the real tail event was the year of 2017, just on the lower end of the spectrum. 1Q18 was more volatile than average, but far from the worst. The 50 print of VIX was more because of liquidity than equity selloff. Also interesting is that 1Q00 and 1Q18 are the only two first quarters when the realized volatility was higher than the average VIX. This may suggest a current tendency of relatively underpricing the volatility.
Key TakeawayComing off the unusually quiet 2017, 1Q18 felt more dramatic than it actually was. As people expect to have strong economy and earnings growth but worry about high equity valuation, rising interest rates and political uncertainties, it seems the volatility is here to stay. The financial environment will be more costly and challenging for risk management. We might have many quarters like 1Q18 down the road, while the chance of repeating 2017 is much lower.
The material provided here is for informational use only. The views expressed are those of the author, and do not necessarily reflect the views of Penn Mutual Asset Management.
This material is for informational use only. The views expressed are those of the author, and do not necessarily reflect the views of Penn Mutual Asset Management. This material is not intended to be relied upon as a forecast, research or investment advice, and it is not a recommendation, offer or solicitation to buy or sell any securities or to adopt any investment strategy.
Opinions and statements of financial market trends that are based on current market conditions constitute judgment of the author and are subject to change without notice. The information and opinions contained in this material are derived from sources deemed to be reliable but should not be assumed to be accurate or complete. Statements that reflect projections or expectations of future financial or economic performance of the markets may be considered forward-looking statements. Actual results may differ significantly. Any forecasts contained in this material are based on various estimates and assumptions, and there can be no assurance that such estimates or assumptions will prove accurate.
Investing involves risk, including possible loss of principal. Past performance is no guarantee of future results. All information referenced in preparation of this material has been obtained from sources believed to be reliable, but accuracy and completeness are not guaranteed. There is no representation or warranty as to the accuracy of the information and Penn Mutual Asset Management shall have no liability for decisions based upon such information.
High-Yield bonds are subject to greater fluctuations in value and risk of loss of income and principal. Investing in higher yielding, lower rated corporate bonds have a greater risk of price fluctuations and loss of principal and income than U.S. Treasury bonds and bills. Government securities offer a higher degree of safety and are guaranteed as to the timely payment of principal and interest if held to maturity.
All trademarks are the property of their respective owners. This material may not be reproduced in whole or in part in any form, or referred to in any other publication, without express written permission.


