Despite renewed optimism for better economic growth after Election Day, the U.S. economy remains stuck at stall speed with full year 2016 gross domestic product (GDP) likely to come in below 2.0%. Consumer spending, supported by improving labor market conditions and long-anticipated wage growth, represented one area of strength during the first half of this year but moderated during the second half. Despite record low interest rates, business investment remains weak due to lingering doubts about economic growth prospects and aggregate demand. Companies continue to borrow heavily but are using the proceeds for equity buybacks and mergers and acquisition (M&A) activity as opposed to capital expenditures.
The unemployment rate in the U.S. has settled into a range between 4.5% and 5.0%. Despite reaching a level which most economists consider to be full employment, the Federal Reserve (Fed) is intent on boosting labor force participation by keeping interest rates “lower for longer.” Long anticipated wage gains finally started to materialize last year due to a tightening labor market and numerous states adopting higher minimum wages policies. Average Hourly Earnings and the Employment Cost Index both rose steadily and reached their highest annual readings since the financial crisis of 2.5% and 2.3% respectively.
The year started with fears of widespread defaults for sovereign and corporate credits tied to the weakness across the commodity complex, but financial markets rebounded sharply thereafter. More dovish commentary from Fed officials during the first quarter helped to weaken the U.S. dollar and ease mounting pressures for sovereign borrowers with substantial dollar denominated liabilities. Financial conditions have eased for corporate borrowers in the public markets since February, and bank lending conditions are also accommodative but have been tightening in recent months. The November election results increased the potential for higher economic growth in 2017, as gridlock in Washington is likely to give way to fiscal policy stimulus and friendlier regulatory environment. Business optimism could finally boost capital spending and generate economic growth above the 2.0% area. On the other hand, protectionist policy measures run the risk of offsetting these near-term economic growth benefits, as well as risking inflation moving above the Fed’s 2.0% target in 2017.
The wide range of potential policy changes following the Republican sweep on Election Day makes forecasting both growth and inflation in 2017 even more challenging. Similarly, investors also face a wider range of outcomes given uncertainty created by the likely transition from monetary stimulus to fiscal stimulus. The capital markets will again experience bouts of heightened volatility.
Monetary PolicyAt the beginning of 2016, markets priced in an additional three interest rate hikes by the Fed. However, tightening credit conditions during the first quarter, disappointing global economic growth and the proliferation of negative interest rate policies in Europe and Japan kept the Fed on hold until December, when the Fed tightened monetary policy for the second time in ten years and more importantly increased the number of expected hikes for 2017 (the so-called “dot plots”) from two to three.
U.S. monetary policy and interest rate levels across the entire yield curve during 2016 have been driven in large part by economic and political developments across the globe. Fears of damaging economic fallout in the U.K. and elsewhere in Europe contributed to the Fed’s indecision at the July Federal Open Market Committee (FOMC) meeting. Minutes from this meeting referenced the Brexit vote no fewer than 20 times.
Tighter monetary policy in the U.S. was also made more challenging in the face of increasing use of quantitative easing and negative interest rate policies by the European Central Bank (ECB), Bank of Japan (BOJ) and Bank of England (BOE). The historic lows set in U.S. Treasury bond yields during July coincided with the BOJ beginning to question the effectiveness of negative interest rate policies. Language from the ECB since mid-year also suggests negative interest rate policies and additional quantitative easing in Europe are gradually losing effectiveness.
Interest Rates and Credit Exhibit 1: Bond Market Performance as of 12/31/16 (Source: Bloomberg Barclays)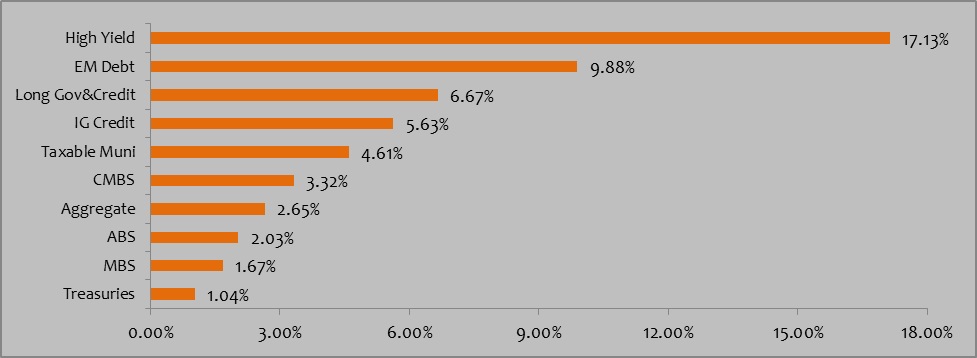
The first and second halves of 2016 have been mirror opposites in terms of interest rate moves. The 10-year Treasury hit a generational low in yields in early July closing at 1.36%, more than 90 basis points lower than where the year started. The proliferation of quantitative easing programs and negative interest rates policies across the globe were the leading causes for the decline. At its peak in early July, more than $14 trillion of global bonds traded with negative yields. In another sign of the power of central bank policies, Swiss government yields were negative out to 50 years. Interest rates reversed course mid-year and finished higher across the entire yield curve by year-end.
By year-end 2016, credit spreads narrowed for investment-grade and high yield credit despite dramatic initial widening. Feb. 11 marked the turning point in valuation across all risk markets, representing the low in oil prices, widest levels for credit spreads and bottom in equity markets. The recovery was not limited to energy and commodity credits and extended across the broad corporate and structured bond markets. High yield bonds generated total returns north of 17% and were the best performing fixed income asset class. Investment grade corporate credit spreads also narrowed and outperformed duration-matched Treasury bonds by nearly 5%.
Despite a short-lived negative reaction to the Brexit decision in June, credit spreads tightened just a week after the vote. The BOE’s decision to join the BOJ and ECB to buy corporate bonds contributed to the turnaround. Highly-rated corporations in Europe and Japan took full advantage of central bank accommodation by issuing new debt at negative yields. Emerging market debt gave back year-to-date gains after Election Day but still generated returns approaching 10%.
Equity MarketsThe global reach for yield has also factored heavily in equity market performance during the first half of the year. Defensive sectors, including utilities, telecom and consumer staples, offered higher dividend yields and posted strong performance, while banks and financials struggled due to the prospect for “lower for longer” interest rates and flattening yield curves. Equity sector performance reversed course after the Trump victory with cyclical, financials and small cap stocks leading the stock market higher. The commodity rally also benefited emerging market equity performance during 2016 after posting years of disappointing results. Equity returns across Europe were again lackluster due to disappointing economic growth and uncertainty surrounding the impact of Brexit.
Exhibit 2: Equity Market Performance as of 12/31/16 (Source: Morningstar and Bloomberg Barclays)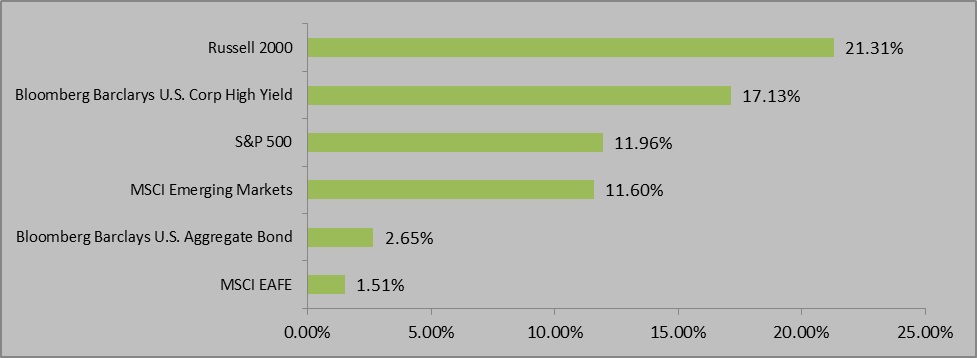 Major Themes
The long-term trend toward greater globalization is peaking and likely to move in the opposite direction after recent election results in the U.S. and Great Britain. The implications for economic growth, inflation and financial market performance are significant. Disinflationary forces from globalization helped drive the 30-year bull market in bonds. Protectionist trade policies, lower tax rates and new infrastructure spending all could add to inflationary pressures, which are already starting to build in the U.S. economy. Reversing the long-standing trend towards globalization also runs the risk of creating economic and financial market instability, especially for numerous emerging market economies heavily dependent on trade.
Globalization is also playing an increasing role in impacting valuations for financial assets in the U.S. Ever-expanding monetary policy accommodation in Japan and Europe kept U.S. interest rates and credit spreads lower than pure domestic economic fundamentals could justify. Looking forward, potential selling of Treasuries from the Chinese central bank in defense of the Yuan will help determine the pace of U.S. monetary policy tightening.
The Trump victory signifies an inflection point in the outlook for growth and inflation in the U.S. Renewed optimism by consumers, businesses and investors should extend the nearly eight year equity bull market into ‘extra innings.’
With 2016 behind us, we’re taking a look at what 2017 will hold for investors. Be sure to check back next week for our 2017 Economic and Market Outlook!
Index Definitions:
Bloomberg Barclays U.S. Aggregate Bond Index – An index that is a broad-based flagship benchmark that measures the investment grade, US dollar-denominated, fixed-rate taxable bond market. The index includes Treasuries, government-related and corporate securities, MBS (agency fixed-rate and hybrid ARM pass-throughs), ABS and CMBS (agency and non-agency).
Bloomberg Barclays U.S. Corp High Yield – an index measures the USD-denominated, high-yield, fixed-rate corporate bond market. Securities are classified as high yield if the middle rating of Moody’s Fitch and S&P is Ba1/BB+/BB+ or below. Bonds from issuers with an emerging markets country of risk, based on Barclays EM country definition, are excluded.
S&P 500 Index – An index of 500 stocks chosen for market size, liquidity and industry grouping, among other factors. The S&P 500 is designed to be a leading indicator of U.S. equities and is meant to reflect the risk/return characteristics of the large cap universe.
MSCI EAFE Index – An index that is designed to measure the equity market performance of developed markets outside of the U.S. & Canada.
Russell 2000 Index – An index measuring the performance approximately 2,000 small-cap companies in the Russell 3000 Index, which is made up of 3,000 of the biggest U.S. stocks.
MSCI Emerging Markets Index - A free float-adjusted market capitalization index that is designed to measure equity market performance in the global emerging markets.
All trademarks are the property of their respective owners.
Disclosures:The views expressed in this material are the views of PMAM through the year ending December 31, 2016, and are subject to change based on market and other conditions. This material contains certain views that may be deemed forward-looking statements. The inclusion of projections or forecasts should not be regarded as an indication that PMAM considers the forecasts to be reliable predictors of future events. Any forecasts contained in this material are based on various estimates and assumptions, and there can be no assurance that such estimates or assumptions will prove accurate. Actual results may differ significantly.
Past performance is not indicative of future results. The views expressed do not constitute investment advice and should not be construed as a recommendation to purchase or sell securities. All information has been obtained from sources believed to be reliable, but accuracy is not guaranteed. There is no representation or warranty as to the accuracy of the information and PMAM shall have no liability for decisions based upon such information.