When the band Ivy released its “Apartment Life” album in October 1997, I had just finished my freshman year in college and was starting a two-year adventure living in Eastern Europe. While I have never considered myself a strong supporter of the indie pop musical genre, to me, that album was symbolic of a potential turning point in the American ethos, which had long been dominated by the baby boomer vision of the American Dream. That vision tended to be family-centric and included homeownership as an ideal form of living. While Ivy’s music album may seem obscure to some, the popular TV show “Friends” exhibited a similar ethos and predated Ivy’s album by a few years. That show glamorized the apartment living lifestyle, which perhaps focuses more on friends than family and more on renting than homeownership. How successful were these pop culture items in decreasing the desire for homeownership?
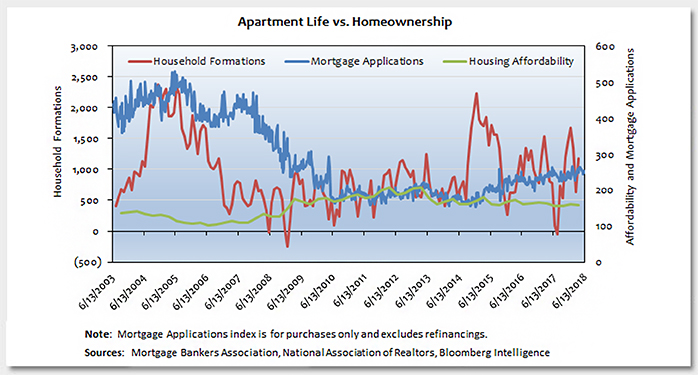
This week’s chart looks at housing data over the past 15 years across a few different housing indices. Since the financial crisis, household formations, on average, have slowly trended up despite the volatility in the numbers over the past five years. Over the same time period, mortgage applications seemed to flatline at a local low from 2010 to 2014, but have since shown signs of life.
Also included in this week’s chart is the Housing Affordability Index. Over the past 15 years, this index has been range-bound between 100 and 200, and it currently sits at a value of 158. As such, the affordability of buying a home in the current economic environment could be considered fair. For several years after the crisis, the availability of mortgage credit remained tight, as underwriting standards were very strong to compensate for the underwriting failures of the housing bubble. However, mortgage credit availability has been improving over the past couple years, with high loan-to-value and non-qualified mortgage loans becoming more common. Since 2014, mortgage applications have trended up while the Housing Affordability Index has remained roughly flat over the same time period.
Key TakeawayThe data supports the notion that new household formation continues to grow. Mortgage credit continues to become more available and housing affordability is in the fair range. Mortgage applications flatlined at a local low for a period of time after the crisis. However, mortgage applications since 2014 have been trending higher, suggesting that the dream of homeownership is alive and well.
The material provided here is for informational use only. The views expressed are those of the author, and do not necessarily reflect the views of Penn Mutual Asset Management.
This material is for informational use only. The views expressed are those of the author, and do not necessarily reflect the views of Penn Mutual Asset Management. This material is not intended to be relied upon as a forecast, research or investment advice, and it is not a recommendation, offer or solicitation to buy or sell any securities or to adopt any investment strategy.
Opinions and statements of financial market trends that are based on current market conditions constitute judgment of the author and are subject to change without notice. The information and opinions contained in this material are derived from sources deemed to be reliable but should not be assumed to be accurate or complete. Statements that reflect projections or expectations of future financial or economic performance of the markets may be considered forward-looking statements. Actual results may differ significantly. Any forecasts contained in this material are based on various estimates and assumptions, and there can be no assurance that such estimates or assumptions will prove accurate.
Investing involves risk, including possible loss of principal. Past performance is no guarantee of future results. All information referenced in preparation of this material has been obtained from sources believed to be reliable, but accuracy and completeness are not guaranteed. There is no representation or warranty as to the accuracy of the information and Penn Mutual Asset Management shall have no liability for decisions based upon such information.
High-Yield bonds are subject to greater fluctuations in value and risk of loss of income and principal. Investing in higher yielding, lower rated corporate bonds have a greater risk of price fluctuations and loss of principal and income than U.S. Treasury bonds and bills. Government securities offer a higher degree of safety and are guaranteed as to the timely payment of principal and interest if held to maturity.
All trademarks are the property of their respective owners. This material may not be reproduced in whole or in part in any form, or referred to in any other publication, without express written permission.


