The ‘Goldilocks’ U.S. economic recovery has now moved beyond its 100th month with few signs of normal late-cycle imbalances or excesses to derail the current expansion. Real GDP growth in the U.S. is best described as steady but not spectacular. Growth showed signs of acceleration recently, with consecutive 3% quarterly prints for GDP. While economic growth in the U.S. is trending higher, long-term secular forces in the economy and tighter monetary policy are likely to keep a lid on potential growth.
Global economic growth is also on track to exceed modest expectations to begin 2018 with broad based contributions from developed and emerging market economies. Growth in Europe and Japan is benefiting from unprecedented levels of central bank monetary stimulus, including negative interest rates and quantitative easing (QE) programs. Risks to global growth arising from potentially disruptive trade protectionism under the Trump presidency never materialized. Commodity prices and emerging market currencies, which both fell sharply after the presidential election, steadily recovered in 2017.
Labor market conditions in the U.S. continue to tighten, and the unemployment rate appears ready to dip below the 4% mark. Labor market tightness has yet to translate into meaningful wage gains as secular forces - globalization, technology and aging demographics - are mitigating typical late-cycle wage pressures. The absence of wage and inflation pressures has allowed the Federal Reserve (Fed) to be patient with monetary policy tightening.
Persistent low inflation is creating growing disagreement among Fed policy makers about the relevance of traditional economic modeling, in particular the Phillips Curve. Core Personal Consumption Expenditure (PCE) - the Fed’s preferred measure of inflation - unexpectedly fell in 2017 and now stands well below its 2% inflation target. The Treasury yield curve flattened in 2017, with low inflation keeping the long-end well bid and incremental Fed tightening pressuring the front-end.
We expect U.S. economic growth to move slightly above recent trends in 2018, but still remain below the 3% level. A temporary bounce in growth and inflation following the natural disasters in Texas, Florida and California may apply more pressure on the Fed to normalize monetary policy. Risks of recession are low with household and bank balance sheets generally healthy.
Monetary PolicyPresident Trump’s selection process for the next Fed Chairman kept the financial markets guessing with five different candidates - Gary Cohn, Kevin Warsh, Janet Yellen, John Taylor and Jerome Powell – spending time as the front runner. Powell’s selection in early November was a relief for many investors concerned by risks of more hawkish policies under Taylor or Warsh. The new Fed Chair is likely to follow Yellen’s more gradualist approach to policy changes, but be easier in terms of banking and financial market regulation.
Janet Yellen’s tenure as Fed Chair is likely to be viewed much more favorably by historians than her numerous critics on both sides of the political aisle. The Fed has successfully delivered on its dual mandate goals of full employment, stable prices and moderate long-term interest rates under her leadership. The Fed’s goal of being more open and transparent regarding policy changes was widely questioned following the “taper tantrum” in 2013. However, under Yellen’s leadership, the new policy resulted in a smooth lift off from the Fed’s zero interest rate policy.
Central bankers adopted unprecedented policy tools following the 2008/2009 credit crisis to prop up economies in free fall. One clearly stated goal of this stimulus was to force investors out of cash and into riskier assets. 2017’s nearly straight-line gains in global equity and credit valuations with record low volatility is another sign new policy tools are working. However, if the “risk” rally continues, central bankers are likely to grow more fearful they are behind the curve to normalize interest rate policy. With more than $8 trillion in global sovereign bonds still trading at negative yields, risks cannot be discounted of markets reacting negatively to faster normalization of global monetary policy than markets are discounting today.
Interest Rates and CreditThe long anticipated bond bear market was expected to begin following the Republican sweep in November 2016. However, once again the consensus view for rising rates was disappointed in 2017. Long-term interest rates in the U.S. remain attractive versus other global fixed income alternatives in a world starved for income.
Investors were once again rewarded in 2017 by buying every back up in Treasury yields. Yields peaked in early March when the 10-year touched 2.62% but closed the year at 2.41%. Even three additional Fed rate hikes in 2017 have yet to kill the extended year bond bull market.
Credit spreads were also supported by the global ‘reach for yield.’ Record corporate bond supply was easily absorbed by the markets as corporate spreads moved to the tightest levels since the financial crisis. Strong demand for U.S. corporate bonds from foreign investors was not surprising given negative yields even for BBB-rated credits in Europe and Japan.
The fundamental economic backdrop has also contributed to spread sector outperformance. Synchronized global growth, higher oil prices and an improving profit picture all factored into steady improvement for spread sectors in 2017.
Exhibit 1: Bond Market Performance as of 12/31/17 (Source: Bloomberg Barclays)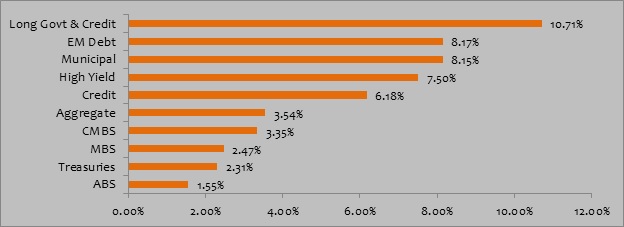
Equity Markets
Equity markets in the U.S. maintained their upward trajectory in 2017, and the S&P 500 Index has now registered gains for nine consecutive quarters.
2017’s performance was marked by near-record-low volatility, with any correction shallow and short-lived. Exceptional performance among large-cap technology names (the so-called FAANG stocks) helped propel the S&P 500 Index to more than 20% gains for the year. Growth stocks across all capitalization levels outperformed value stocks for the year.
Exhibit 2: Equity Market Performance as of 12/31/17 (Source: Morningstar and Bloomberg Barclays)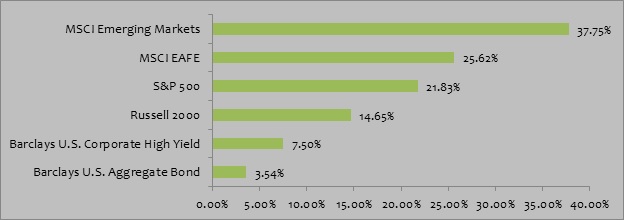
The trend toward passive equity investing in capitalization-weighted indices such as the S&P 500 has systematically boosted demand for the largest-cap names. The self-reinforcing nature of the trend toward passive has made active manager outperformance more challenging and poses risks of a disorderly unwind once equity returns turn negative and flows reverse.
Following years of disappointing results and lagging the U.S. stock market for five years running, international equities outperformed in 2017. Economies in Europe and Japan finally appear to be reaping the benefits of extraordinary monetary accommodation, including QE and negative interest rate policies. The International Monetary Fund (IMF) recently raised its global economic growth estimate to 3.6% for 2017 and 3.8% for 2018 due to broad-based strength among both developed and emerging market economies.
With 2017 in the books, we are actively looking at what 2018 has in store for investors. Be sure to check back for our 2018 Economic and Market Outlook!
Index Definitions:
Bloomberg Barclays U.S. Aggregate Bond Index – An index that is a broad-based flagship benchmark that measures the investment grade, US dollar-denominated, fixed-rate taxable bond market. The index includes Treasuries, government-related and corporate securities, MBS (agency fixed-rate and hybrid ARM pass-throughs), ABS and CMBS (agency and non-agency).
Bloomberg Barclays U.S. Corp High Yield – an index measures the USD-denominated, high-yield, fixed-rate corporate bond market. Securities are classified as high yield if the middle rating of Moody’s Fitch and S&P is Ba1/BB+/BB+ or below. Bonds from issuers with an emerging markets country of risk, based on Barclays EM country definition, are excluded.
S&P 500 Index – An index of 500 stocks chosen for market size, liquidity and industry grouping, among other factors. The S&P 500 is designed to be a leading indicator of U.S. equities and is meant to reflect the risk/return characteristics of the large cap universe.
MSCI EAFE Index – An index that is designed to measure the equity market performance of developed markets outside of the U.S. & Canada.
Russell 2000 Index – An index measuring the performance approximately 2,000 small-cap companies in the Russell 3000 Index, which is made up of 3,000 of the biggest U.S. stocks.
MSCI Emerging Markets Index - A free float-adjusted market capitalization index that is designed to measure equity market performance in the global emerging markets.
All trademarks are the property of their respective owners.
Disclosures:The views expressed in this material are the views of PMAM through the year ending December 31, 2017, and are subject to change based on market and other conditions. This material contains certain views that may be deemed forward-looking statements. The inclusion of projections or forecasts should not be regarded as an indication that PMAM considers the forecasts to be reliable predictors of future events. Any forecasts contained in this material are based on various estimates and assumptions, and there can be no assurance that such estimates or assumptions will prove accurate. Actual results may differ significantly.
Past performance is not indicative of future results. The views expressed do not constitute investment advice and should not be construed as a recommendation to purchase or sell securities. All information has been obtained from sources believed to be reliable, but accuracy is not guaranteed. There is no representation or warranty as to the accuracy of the information and PMAM shall have no liability for decisions based upon such information.