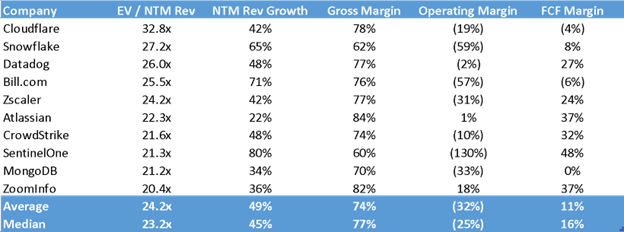
; Top 10 Software EV/NTM Revenue Multiples as of 11/19/2021")
With the backdrop of higher interest rates, inflation, supply chain issues, labor shortages and a possible recession on the horizon, 2022 has not been kind to the stock market. As of May 2, the S&P 500 Index is down 13.7% year-to-date (YTD), the NASDAQ has decreased 21.2% YTD and the Dow Jones Industrial Average is down roughly 9.7% YTD. Technology stocks, and software in particular, have experienced serious multiple contraction since the beginning of the year and even more drastically when compared to 2021.
Marc Andreessen, co-founder of venture capital firm Andreessen Horowitz, famously said back in 2011 that “software is eating the world.” His comments referred specifically to how many large businesses and industries were being run on software, delivered as online services, as well as the attractiveness of the business model given the flexibility, growth rates and margins of these businesses. Looking at the environment today, some of the largest technology companies in the world have enormous cloud software segments, including Amazon (AWS) and Microsoft (Azure).
The market has clearly realized this technological evolution and rewarded many software businesses with large market caps, such as Adobe ($192 billion), Salesforce ($175 billion) and ServiceNow ($97 billion), as of May 2. The software sector has also attracted the attention of private equity (PE) investors, with two large PE firms, Thoma Bravo and Vista Equity Partners, solely focused on investing in private technology and software companies given the attractive financial profile and scalability of these enterprises.
So why do investors appreciate the software business model? There are many items to consider but growth rates, gross margins, scalability, high switching costs and recurring revenue streams are some reasons why. Taking a look at the top 10 public software companies in terms of EV/NTM Revenue (enterprise value/next 12 months) as of last week, the median NTM revenue growth rate was 45% and the median gross margin was 77%.
While a majority of these companies operate at negative operating and free-cash-flow (FCF) margins, investors had continued to bid these assets up to inflated valuations. In addition, software and software-enabled stocks fared extremely well throughout the pandemic as large enterprises, small-and-medium businesses (SMBs) and education systems migrated to remote work and learning.
This week’s chart, which displays data from the week prior to Thanksgiving 2021, gives a great overview of just how frothy the market had become for public software valuations. The median software company in this data set was trading above 56 times its next 12 months’ sales while the median operating margin was negative 52%. The market seemed to care much more about growth metrics than profitability and cash-flow generation.
At some point, this phenomenon had to end and we’ve witnessed that given the valuations in the market today. When comparing the chart below as of 4/29/22 with the chart as of 11/19/2021, median software multiples have contracted roughly 58% since November 2021 thanks to the macro environment and the Federal Reserve’s (Fed) desire to raise interest rates. Growth companies, such as software, are long-duration assets. Their overall value is largely based on their terminal value and are more sensitive to interest-rate increases.
Source: Clouded Judgement Newsletter (4/29/2022); Top 10 Software EV/NTM Revenue Multiples as of 4/29/2022
Finally, software will continue to be an important part of every organization moving forward, as it allows companies to be more nimble and build iterative processes across different functions of the business in a more cost-efficient manner. We have talked mostly about public market software in this post; however, the private market for software continues to grow at an astounding pace as well.
As of January 2021, there were a total of 527 private unicorns, with a cumulative value of more than $1.9 trillion. Furthermore, there continues to be significant demand for software assets. This will only continue as spending on dedicated cloud infrastructure is expected to grow at a compound annual growth rate of 11.5% through 2025.
Key Takeaway
Given the risk of inflation, geopolitical uncertainty, higher interest rates and other macro headwinds, the stock market has had a difficult start to the year, with software businesses seeing significant multiple contraction since 2021. The ultimate debate in the market today is what multiple investors are willing to pay for these businesses based on how mission-critical their offerings are to the underlying enterprises they serve, their retention metrics as well as the proper mix of growth and profitability moving forward.
The material provided here is for informational use only. The views expressed are those of the author, and do not necessarily reflect the views of Penn Mutual Asset Management.
This material is for informational use only. The views expressed are those of the author, and do not necessarily reflect the views of Penn Mutual Asset Management. This material is not intended to be relied upon as a forecast, research or investment advice, and it is not a recommendation, offer or solicitation to buy or sell any securities or to adopt any investment strategy.
Opinions and statements of financial market trends that are based on current market conditions constitute judgment of the author and are subject to change without notice. The information and opinions contained in this material are derived from sources deemed to be reliable but should not be assumed to be accurate or complete. Statements that reflect projections or expectations of future financial or economic performance of the markets may be considered forward-looking statements. Actual results may differ significantly. Any forecasts contained in this material are based on various estimates and assumptions, and there can be no assurance that such estimates or assumptions will prove accurate.
Investing involves risk, including possible loss of principal. Past performance is no guarantee of future results. All information referenced in preparation of this material has been obtained from sources believed to be reliable, but accuracy and completeness are not guaranteed. There is no representation or warranty as to the accuracy of the information and Penn Mutual Asset Management shall have no liability for decisions based upon such information.
High-Yield bonds are subject to greater fluctuations in value and risk of loss of income and principal. Investing in higher yielding, lower rated corporate bonds have a greater risk of price fluctuations and loss of principal and income than U.S. Treasury bonds and bills. Government securities offer a higher degree of safety and are guaranteed as to the timely payment of principal and interest if held to maturity.
All trademarks are the property of their respective owners. This material may not be reproduced in whole or in part in any form, or referred to in any other publication, without express written permission.